
Q360 reporting options
Use Q360 Live Data and Dashboards for day-to-day questions about open quotes, accounts receivable aging, inventory, and project margin.
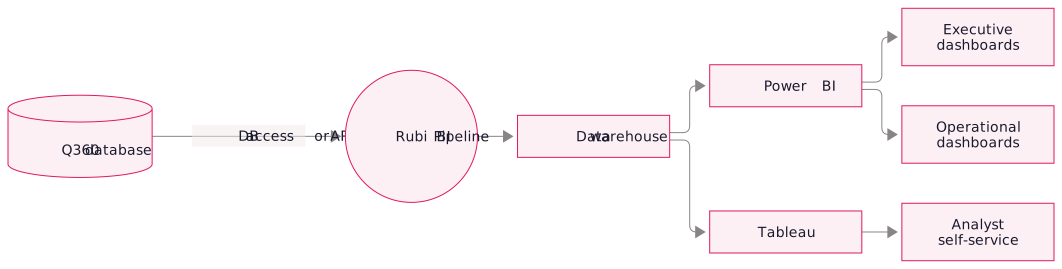
Power BI and Tableau can combine Q360 with accounting or CRM data, compare periods, and let executives drill into results across multiple dimensions.
How we build Q360 dashboards
We connect Q360 to Power BI or Tableau and build dashboards around the metrics your team needs.
Your data is already in Q360. We give you the dashboards that make it visible, interactive, and trustworthy, for the people who aren't in Q360 every day.
Reporting tools
Five phases of a BI project
- Discovery. We review your current reports and identify the KPIs that would change a decision.
- Piloting. We test 1–2 KPIs in a small Power BI report connected to Q360 through database access or an API.
- Development. We build, test, and refine dashboards for the agreed KPIs.
- Training. We show your team how to use the dashboards and trace the numbers to their sources.
- Ongoing optimization. We tune dashboards and add data sources and KPIs as your priorities change.
Q360 dashboard examples
- Project margin tracker: actual vs budgeted margin per project, with drill-down to labor hours, parts cost, change orders, and subcontractor spend
- AR aging and collections forecast: current aging bucket by customer, predicted cash-in for the next 30/60/90 days, collection-action status
- Sales velocity dashboard: pipeline value, close rate by stage, win/loss by salesperson, average time-to-close, and forecast by month
- Inventory turns and obsolescence: stock value by warehouse, days-on-shelf, items that haven't moved in 90+ days, and suggested reorder quantities
- Labor utilization: billable hours by tech, project vs service mix, utilization against target, and unplanned time
- Executive summary: one-page snapshot combining revenue, margin, pipeline, cash, and headcount for board and investor meetings
Frequently asked questions
No, only for the users who consume the reports interactively. Most shops end up with Pro licenses for executives and department heads, and publish the same content to everyone else as exported PDFs or embedded dashboards.
No. We run the BI pipeline against a replica or read-replica of your Q360 database (or via the Q360 API), so dashboard refreshes don't compete with operational queries.
We regularly combine Q360 with accounting (QuickBooks, NetSuite), CRM (HubSpot, Salesforce), HRIS (ADP, BambooHR), and other operational data.
Pilot phase is usually 2-3 weeks. Full dashboard build phase is 6-10 weeks depending on number of dashboards and data-source complexity. Most clients see initial value within the first month.